 Clarksville, TN – As expected, the Federal Open Market Committee did not alter the pace of asset purchases (currently $85 billion per month). The FOMC noted that “the recovery in the housing sector slowed somewhat in recent months,” but removed the phrase (from the September 18th statement that “the tightening of financial conditions observed in recent months, if sustained, could slow the pace of improvement in the economy and labor market.”
That suggests that the Fed could still begin to taper the pace of asset purchases at the December policy meeting if the economic data between now and then are strong enough (although that’s not seen as likely).

Retail sales edged down 0.1%, reflecting a drop in auto sales (up 0.4% otherwise). The ISM Manufacturing Index was stronger than expected in October, with strong breadth of improvement, but comments from supply managers were mixed.
Next week, two key reports arrive. The advance GDP estimate is always an adventure, as the government is missing some of the components and will have to make assumptions. The financial markets typically focus on the headline figure, which is expected to be relatively lackluster in 3Q13, but the details are what’s important.
Due to the way the data is collected, the partial government shutdown is likely to have a limited impact on the October nonfarm payroll figures, but should boost the unemployment rate significantly. The Bureau of Labor Statistics will provide some estimate of the impact from the shutdown.
Indices
| Last | Last Week | YTD return % | |
| DJIA | 15545.75 | 15509.21 | 18.63% |
| NASDAQ | 3919.71 | 3928.96 | 29.81% |
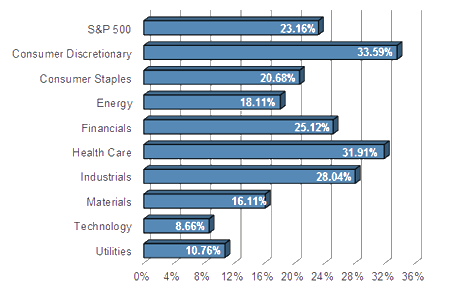
| S&P 500 | 1756.54 | 1752.07 | 23.16% |
| MSCI EAFE | 1878.39 | 1896.55 | 17.11% |
| Russell 2000 | 1100.15 | 1118.85 | 29.53% |
Consumer Money Rates
| Last | 1-year ago | |
| Prime Rate | 3.25 | 3.25 |
| Fed Funds | 0.08 | 0.17 |
| 30-year mortgage | 4.10 | 3.39 |
Currencies
| Last | 1-year ago | |
| Dollars per British Pound | 1.605 | 1.613 |
| Dollars per Euro | 1.360 | 1.297 |
| Japanese Yen per Dollar | 98.310 | 79.850 |
| Canadian Dollars per Dollar | 1.043 | 1.000 |
| Mexican Peso per Dollar | 13.027 | 13.077 |
Commodities
| Last | 1-year ago | |
| Crude Oil | 96.38 | 86.24 |
| Gold | 1323.66 | 1719.28 |
Bond Rates
| Last | 1-month ago | |
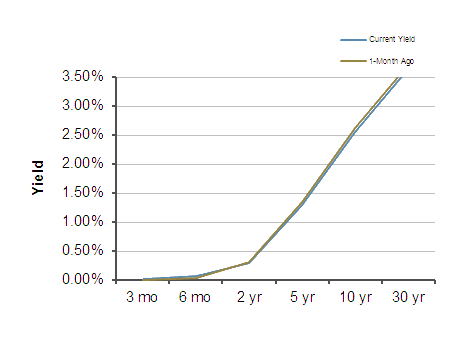
| 2-year treasury | 0.31 | 0.32 |
| 10-year treasury | 2.58 | 2.62 |
| 10-year municipal (TEY) | 4.26 | 4.37 |
Treasury Yield Curve – 11/01/2013
S&P Sector Performance (YTD) – 11/01/2013
Economic Calendar
| November 4th |
— |
Factory Orders (August, September) |
| November 5th |
— |
ISM Non-Manufacturing Index (October) |
| November 6th |
— |
Leading Economic Indicators (September) |
| November 7th |
— |
Jobless Claims (week ending November 2nd) Real GDP (3Q13, advance estimate) |
| November 8th |
— |
Employment Report (October) Personal Income and Spending (September) |
| November 11th |
— |
Veterans Day (bond market closed) |
| November 15th |
— |
Industrial Production (October) |
Important Disclosures
US government bonds and treasury bills are guaranteed by the US government and, if held to maturity, offer a fixed rate of return and guaranteed principal value. US government bonds are issued and guaranteed as to the timely payment of principal and interest by the federal government. Treasury bills are certificates reflecting short-term (less than one year) obligations of the US government.
Commodities trading is generally considered speculative because of the significant potential for investment loss. Markets for commodities are likely to be volatile and there may be sharp price fluctuations even during periods when prices overall are rising. Specific sector investing can be subject to different and greater risks than more diversified investments.
Tax Equiv Muni yields (TEY) assume a 35% tax rate on triple-A rated, tax-exempt insured revenue bonds.
![]() Material prepared by Raymond James for use by its financial advisors.
Material prepared by Raymond James for use by its financial advisors.
The information contained herein has been obtained from sources considered reliable, but we do not guarantee that the foregoing material is accurate or complete. Data source: Bloomberg, as of close of business October 31st, 2013.
©2013 Raymond James Financial Services, Inc. member FINRA / SIPC.


