Market Commentary by Scott J. Brown, Ph.D., Chief Economist

The economic data were mixed. Real GDP growth for the third quarter was revised to a 2.5% annual rate (vs. +2.0% in the advance estimate), reflecting upward revisions to consumer spending (now at a 2.8% pace), exports, and state and local government spending. Inventory growth was revised lower, still at an unsustainable pace (implying an expected drag on GDP growth in Q410). Personal income and spending were moderately strong in October. The PCE Price Index ex-food & energy was flat, up just 0.9% year-over-year.
October home sales figures disappointed. Factory orders, normally choppy from month-to-month, fell sharply (one month does not a trend make, but this bears watching closely over the near term). Consumer sentiment improved in the full-month reading for November (still very low). No surprise, the minutes of the November 2-3 FOMC policy meeting showed some difference of opinion among senior Fed officials regarding the Fed’s asset purchase program. Fed officials revised lower their forecasts of growth in 2011, with lackluster improvement in the unemployment rate (a central tendency forecast of 8.9% to 9.1% in Q411). Weekly claims for state unemployment insurance benefits fell sharply – these figures are often very choppy during this time of year, but the underlying trend may be coming down.
Financial market activity was choppy amid the mixed economic data. Investors also kept an eye on the developing bailout for Ireland, with growing concerns about Portugal and Spain.
Next week, November data will start rolling in. We could see reactions to a number of the economic reports, but the focus will be on Friday’s employment figures. Nonfarm payrolls are expected to have risen by about 140,000, a pace which would be okay in normal times, but is not enough to push the unemployment rate down (likely to remain at 9.6%). Job growth is a key factor in the consumer spending outlook and is critical for an eventual recovery in the housing sector. For some months, the rate of job destruction has appeared relatively limited. The main issue has been a lack of job creation, but that may be starting to change.
Indices
| Last | Last Week | YTD return % | |
| DJIA | 11187.28 | 11181.23 | 7.28% |
| NASDAQ | 2453.12 | 2514.4 | 12.07% |
| S&P 500 | 1198.35 | 1196.69 | 7.47% |
| MSCI EAFE | 1591.96 | 1628.07 | 0.71% |
| Russell 2000 | 736.53 | 720.84 | 17.77% |
Consumer Money Rates
| Last | 1-year ago | |
| Prime Rate | 3.25 | 3.25 |
| Fed Funds | 0.25 | 0.25 |
| 30-year mortgage | 4.55 | 4.96 |
Currencies
| Last | 1-year ago | |
| Dollars per British Pound | 1.577 | 1.667 |
| Dollars per Euro | 1.338 | 1.508 |
| Japanese Yen per Dollar | 83.610 | 87.680 |
| Canadian Dollars per Dollar | 1.009 | 1.049 |
| Mexican Peso per Dollar | 12.386 | 12.860 |
Commodities
| Last | 1-year ago | |
| Crude Oil | 38.07 | 35.65 |
| Gold | 1375.00 | 1185.18 |
Bond Rates
| Last | 1-month ago | |
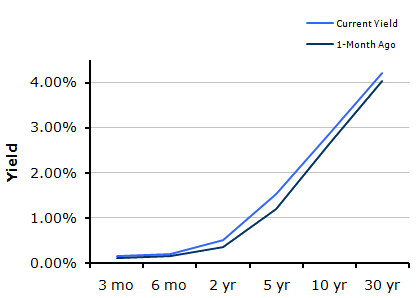
| 2-year treasury | 0.51 | 0.36 |
| 10-year treasury | 2.86 | 2.63 |
| 10-year municipal (TEY) | 4.77 | 3.98 |
Treasury Yield Curve – 11/26/2010

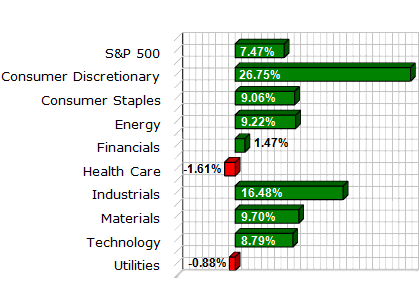
S&P Sector Performance (YTD) – 11/26/2010

Economic Calendar
| November 30th | — | S&P/Case-Shiller Home Price Index (September) Chicago Purchasing Mangers Index (November) Consumer Confidence (November) |
| December 1st | — | ADP Payroll Estimate (November) ISM Manufacturing Index (Novembers) Unit Auto Sales (November) Fed Beige Book |
| December 2nd | — | Jobless Claims (week ending November 27th) Pending Home Sales (October) |
| December 3rd | — | Employment Report (November) ISM Non-Manufacturing Index (November) |
| December 10th | — | International Trade (October) |
| December 14th | — | FOMC Meeting |
Important Disclosures
Past performance is not a guarantee of future results. There are special risks involved with global investing related to market and currency fluctuations, economic and political instability, and different financial accounting standards. The above material has been obtained from sources considered reliable, but we do not guarantee that it is accurate or complete. There is no assurance that any trends mentioned will continue in the future. While interest on municipal bonds is generally exempt from federal income tax, it may be subject to the federal alternative minimum tax, state or local taxes. In addition, certain municipal bonds (such as Build America Bonds) are issued without a federal tax exemption, which subjects the related interest income to federal income tax. Investing involves risk and investors may incur a profit or a loss.
US government bonds and treasury bills are guaranteed by the US government and, if held to maturity, offer a fixed rate of return and guaranteed principal value. US government bonds are issued and guaranteed as to the timely payment of principal and interest by the federal government. Treasury bills are certificates reflecting short-term (less than one year) obligations of the US government.
Commodities trading is generally considered speculative because of the significant potential for investment loss. Markets for commodities are likely to be volatile and there may be sharp price fluctuations even during periods when prices overall are rising. Specific sector investing can be subject to different and greater risks than more diversified investments.
Tax Equiv Muni yields (TEY) assume a 35% tax rate on triple-A rated, tax-exempt insured revenue bonds.
![]() Material prepared by Raymond James for use by its financial advisors.
Material prepared by Raymond James for use by its financial advisors.
The information contained herein has been obtained from sources considered reliable, but we do not guarantee that the foregoing material is accurate or complete. Data source: Bloomberg, as of close of business November 25th, 2010.
©2010 Raymond James Financial Services, Inc. member FINRA / SIPC.


