Market Commentary by Scott J. Brown, Ph.D., Chief Economist

The Federal Open Market Committee (FOMC) left short-term interest rates unchanged and repeated that “economic conditions, including low rates of resource utilization, subdued inflation trends, and stable inflation expectations, are likely to warrant exceptionally low levels of the federal funds rate for an extended period.” In its assessment of the economic outlook, the FOMC noted that “the pace of economic recovery is likely to be more modest in the near term than had been anticipated.”
More importantly, the FOMC voted to keep the level of its securities holdings constant by reinvesting principal payments from agency debt and agency mortgage-backed securities in long-term Treasury securities. By itself, this isn’t a huge move, but it is an important signal that the Fed could do more later on.
The economic data remained consistent with a near-term slowing in the pace of the economic recovery. Retail sales posted lackluster gain for July, with core sales roughly flat over the last four months (following strong gains in February and March). The trade balance widened much more than expected in June, implying (all else being equal) a downward revision to the estimate of second quarter 2010 gross domestic product (GDP) growth. The Consumer Price Index (CPI) rose 0.3% in July, boosted by a seasonal quirk in the price of gasoline – up 4.6%, but actually down 0.1% before seasonal adjustment – and by a 1.6% increase in tobacco. Ex-food and energy, the CPI rose 0.1% (+0.13009% before rounding), up just 0.9% year-over-year.
Next week, the important economic data pile up on Tuesday. The Producer Price Index carries less weight for the markets when it follows the release of the CPI. Building permits and housing starts may still be subject to some noise coming from July. Industrial production will get a boost from hotter temperatures around the country (greater utility output), with manufacturing output likely higher – but indicating a somewhat slower trend. The Index of Leading Economic Indicators should edge up, the recent trend showing consistency with a slow patch in growth, but not yet signaling a double dip.
Indices
| Last | Last Week | YTD return % | |
| DJIA | 10319.95 | 10674.98 | -1.04% |
| NASDAQ | 2190.27 | 2293.06 | -3.48% |
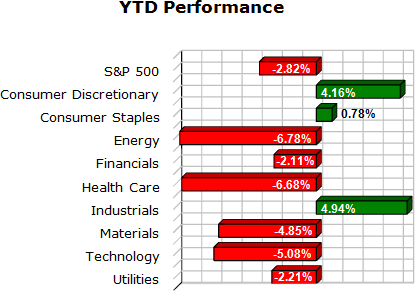
| S&P 500 | 1083.61 | 1125.81 | -2.82% |
| MSCI EAFE | 1452.1 | 1517.55 | -8.14% |
| Russell 2000 | 616.98 | 655.07 | -1.34% |
Consumer Money Rates
| Last | 1-year ago | |
| Prime Rate | 3.25 | 3.25 |
| Fed Funds | 0.25 | 0.25 |
| 30-year mortgage | 4.52 | 5.49 |
Currencies
| Last | 1-year ago | |
| Dollars per British Pound | 1.558 | 1.652 |
| Dollars per Euro | 1.285 | 1.422 |
| Japanese Yen per Dollar | 85.940 | 96.130 |
| Canadian Dollars per Dollar | 1.043 | 1.089 |
| Mexican Peso per Dollar | 12.714 | 12.982 |
Commodities
| Last | 1-year ago | |
| Crude Oil | 75.74 | 70.16 |
| Gold | 1213.35 | 949.88 |
Bond Rates
| Last | 1-month ago | |
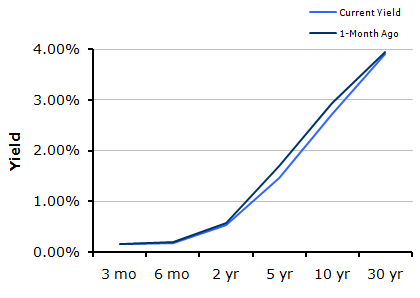
| 2-year treasury | 0.54 | 0.58 |
| 10-year treasury | 2.71 | 2.94 |
| 10-year municipal (TEY) | 4.14 | 4.46 |
Treasury Yield Curve – 8/13/2010

S&P Sector Performance Charts – 8/13/2010

Economic Calendar
| August 16 | — | Empire State Manufacturing Index (August) |
| August 17 | — | Producer Price Index (July)
Residential Construction (July) Industrial Production (July) |
| August 19 | — | Jobless Claims (week ending August 14)
Philadelphia Fed Survey (August) Index of Leading Economic Indicators (July) |
| August 24 | — | Existing Home Sales (July) |
| August 25 | — | Durable Goods Orders (July)
New Home Sales (July) |
| August 27 | — | Real GDP (2Q10, 2nd estimate) |
| September 6 | — | Labor Day Holiday (markets closed) |
| September 21 | — | FOMC Meeting |
Important Disclosures
Past performance is not a guarantee of future results. There are special risks involved with global investing related to market and currency fluctuations, economic and political instability, and different financial accounting standards. The above material has been obtained from sources considered reliable, but we do not guarantee that it is accurate or complete. There is no assurance that any trends mentioned will continue in the future. While interest on municipal bonds is generally exempt from federal income tax, it may be subject to the federal alternative minimum tax, state or local taxes. In addition, certain municipal bonds (such as Build America Bonds) are issued without a federal tax exemption, which subjects the related interest income to federal income tax. Investing involves risk and investors may incur a profit or a loss.
US government bonds and treasury bills are guaranteed by the US government and, if held to maturity, offer a fixed rate of return and guaranteed principal value. US government bonds are issued and guaranteed as to the timely payment of principal and interest by the federal government. Treasury bills are certificates reflecting short-term (less than one year) obligations of the US government.
Commodities trading is generally considered speculative because of the significant potential for investment loss. Markets for commodities are likely to be volatile and there may be sharp price fluctuations even during periods when prices overall are rising. Specific sector investing can be subject to different and greater risks than more diversified investments.
Tax Equiv Muni yields (TEY) assume a 35% tax rate on triple-A rated, tax-exempt insured revenue bonds.
![]() Material prepared by Raymond James for use by its financial advisors.
Material prepared by Raymond James for use by its financial advisors.
The information contained herein has been obtained from sources considered reliable, but we do not guarantee that the foregoing material is accurate or complete. Data source: Bloomberg, as of close of business August 12th, 2010.
©2010 Raymond James Financial Services, Inc. member FINRA / SIPC.


